Where the classifier flags internal waves in the SWOT archive
SWOT internal waves, full_data_v1.h5, frozen RF-DETR classifier, validation only
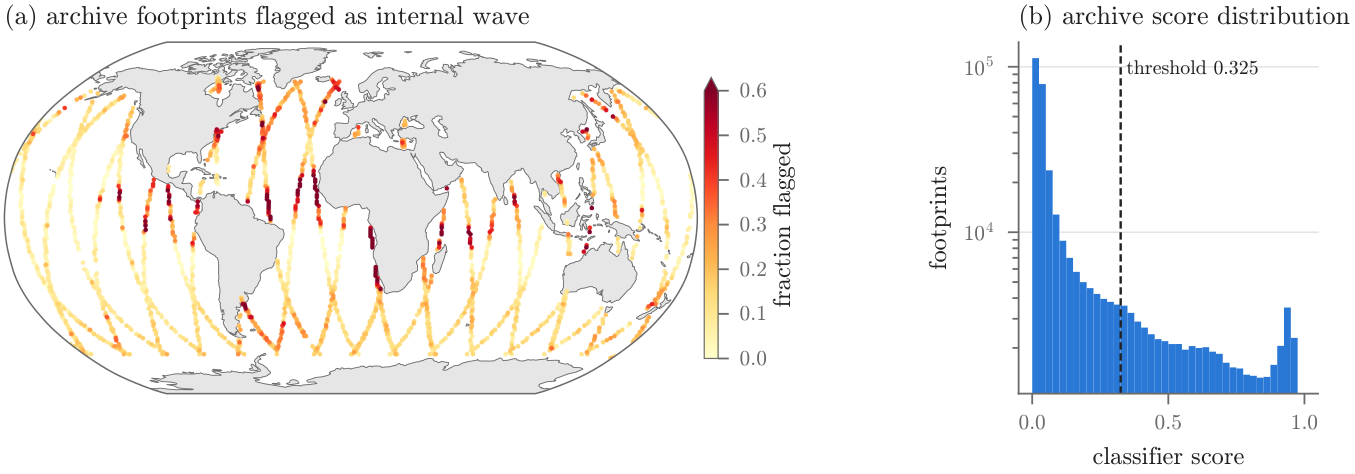
The frozen internal-wave classifier was run over every footprint in the group's SWOT archive file. This page shows how Figure 3 of the progress report is made, from the h5 file to the world map, with the code for each step and the numbers it produced.
From archive to map
- Read every footprint. full_data_v1.h5 holds 164,714 scenes, each split into a left and a right footprint, 329,428 in all. Each group is named Pass_XXX/cycle_pass_line/side. The file stores the image but not its position.
- Score it. scan_h5.py gives the footprint (SSH channel dropped) to the three RF-DETR seeds of cls_iwfp_dropssh_fusion3 and averages their top box scores. A footprint is flagged when the mean is 0.325 or more. One Slurm array task per pass, job 15031109.
- Place it on the globe. footprint_latlon.py turns (pass, line, side) into latitude and longitude with an orbit model fitted to the 1,100 labeled footprints, which carry real coordinates in iw_master.csv.
- Write one CSV per pass. runs/scan_full/Pass_001.csv to Pass_028.csv, one row per footprint with the three seed scores, the fused score, the flag, the best box and both positions.
- Bin and draw. scan() counts footprints and flags in 1° by 1° cells, keeps cells with at least 10 footprints, colours each by the fraction flagged and draws it with cartopy on a Robinson projection.
Where the positions come from
The orbit model is a circular orbit with seven free parameters, fitted by least squares to the 1,100 labeled footprints. Only a starting guess was given, and the fit lands on SWOT's real orbit. The inclination comes out at 77.58° and the Earth turns 1/14 of a day per revolution, which is the 1-day repeat Cal/Val orbit of early 2023. That is why the archive has exactly 28 passes, 14 ascending and 14 descending.
| parameter | fitted value | meaning |
|---|---|---|
| incl_rad | 77.58° | orbit inclination (SWOT is 77.6°) |
| earth_turns_per_rev | 0.07143 = 1/14.00 | 14 revolutions per day, the 1-day repeat orbit |
| lam0_rad | 22.46° | longitude of the orbit node |
| phase_asc_rad, phase_desc_rad | 0.0175, 0.0054 | along-track start of ascending and descending passes |
| rad_per_line | 3.791e-05 | orbit angle per image line, about 242 m |
| crosstrack_km | -1.14 km | offset of the scene centre from nadir |
Each labeled pass also gets a small along-track phase correction, kept only if it predicts held-out footprints of that pass to within 10 km. Passes without labels use the global fit alone, whose leave-one-pass-out error has a median of 6.8 km.
Measured on the labeled footprints with the final model and pass 22 left out, the median error is 1.75 km and 95% are within 6.0 km. 3 of 1,033 are more than 50 km off. The 67 labeled footprints of pass 22 sit a median 301 km from the orbit, so their coordinates in the label file look wrong, and that pass gets no correction. A one-degree cell is about 110 km wide, so none of this moves the map.
| pass | direction | footprints | flagged | labeled | global fit, held-out km | with correction, km | latitude range |
|---|---|---|---|---|---|---|---|
| 1 | asc | 5,730 | 18.7% | - | no labels | - | -64° to 44° |
| 2 | desc | 6,472 | 7.7% | - | no labels | - | -64° to 60° |
| 3 | asc | 10,064 | 14.6% | 19 | 7.0 | 0.9 | -63° to 42° |
| 4 | desc | 15,322 | 15.2% | 102 | 6.6 | 3.5 | -64° to 61° |
| 5 | asc | 18,150 | 22.1% | 121 | 1.2 | 1.6 | -63° to 64° |
| 6 | desc | 8,894 | 17.8% | 28 | 8.2 | 0.9 | -64° to 45° |
| 7 | asc | 10,424 | 22.2% | 86 | 2.2 | 3.2 | -77° to 64° |
| 8 | desc | 7,794 | 13.9% | - | no labels | - | -62° to 20° |
| 9 | asc | 12,666 | 17.7% | 21 | 6.0 | 2.4 | -63° to 64° |
| 10 | desc | 11,790 | 14.3% | 53 | 7.5 | 0.9 | -64° to 17° |
| 11 | asc | 12,716 | 17.9% | 85 | 11.2 | 1.1 | -64° to 62° |
| 12 | desc | 11,362 | 19.4% | - | no labels | - | -64° to 18° |
| 13 | asc | 13,764 | 10.2% | - | no labels | - | -63° to 38° |
| 14 | desc | 7,060 | 16.9% | - | no labels | - | -64° to 37° |
| 15 | asc | 16,806 | 8.3% | - | no labels | - | -66° to 56° |
| 16 | desc | 8,332 | 32.8% | 72 | 16.9 | 1.5 | -64° to 78° |
| 17 | asc | 15,796 | 12.1% | 52 | 11.8 | 2.8 | -64° to 59° |
| 18 | desc | 18,462 | 22.3% | 127 | 2.3 | 1.6 | -64° to 64° |
| 19 | asc | 13,264 | 12.8% | 27 | 5.0 | 1.1 | -63° to 58° |
| 20 | desc | 14,828 | 25.1% | 87 | 3.8 | 3.5 | -64° to 63° |
| 21 | asc | 9,006 | 21.9% | 32 | 8.5 | 1.0 | -63° to 56° |
| 22 | desc | 7,904 | 23.5% | 67 | 306.1 | not kept | -62° to 77° |
| 23 | asc | 9,292 | 8.6% | - | no labels | - | -63° to 12° |
| 24 | desc | 11,866 | 18.3% | 111 | 6.3 | 2.3 | -64° to 23° |
| 25 | asc | 10,496 | 15.5% | - | no labels | - | -63° to 10° |
| 26 | desc | 16,544 | 13.3% | - | no labels | - | -63° to 78° |
| 27 | asc | 8,044 | 23.7% | 10 | 3.6 | 0.4 | -64° to 14° |
| 28 | desc | 16,580 | 7.6% | - | no labels | - | -64° to 58° |
Why the cutoff is 0.325
0.325 is the cutoff with the highest Youden's J on the 110 validation footprints, 58 with waves and 52 without. J is the share of wave footprints caught minus the share of no-wave footprints flagged, so it treats a missed wave and a false alarm as equally bad. It is not the mean score. The validation scores average 0.43 and the archive scores average 0.15.
| cutoff | missed (of 58) | false alarms (of 52) | Youden J | archive flagged |
|---|---|---|---|---|
| 0.1 | 2 | 12 | 0.735 | 30.8% |
| 0.2 | 3 | 8 | 0.794 | 22.8% |
| 0.3 | 4 | 4 | 0.854 | 17.7% |
| 0.325 | 4 | 4 | 0.854 | 16.6% |
| 0.4 | 8 | 3 | 0.804 | 13.7% |
| 0.5 | 13 | 0 | 0.776 | 10.8% |
| 0.7 | 19 | 0 | 0.672 | 5.9% |
| 0.9 | 29 | 0 | 0.500 | 2.4% |
The validation set is about half waves and the archive almost certainly is not, so on the archive this cutoff lets through more false alarms for every real wave. The cutoff is not final. It will be chosen from a labeled random sample of archive flags.
Hotspot cells
The 30 cells with the highest fraction flagged among cells with at least 50 footprints. Over all 2,036 cells on the map, the median cell flags 12.5% and 89 cells flag more than half.
| cell centre | footprints | flagged | fraction flagged | mean score |
|---|---|---|---|---|
| 13.5°N, 18.5°W | 198 | 186 | 94% | 0.815 |
| 10.5°N, 17.5°W | 198 | 186 | 94% | 0.839 |
| 12.5°N, 17.5°W | 194 | 180 | 93% | 0.794 |
| 14.5°N, 18.5°W | 198 | 182 | 92% | 0.788 |
| 10.5°S, 11.5°E | 106 | 92 | 87% | 0.790 |
| 9.5°N, 17.5°W | 198 | 171 | 86% | 0.767 |
| 14.5°N, 26.5°W | 196 | 166 | 85% | 0.723 |
| 17.5°N, 18.5°W | 198 | 161 | 81% | 0.653 |
| 32.5°S, 16.5°E | 200 | 161 | 80% | 0.581 |
| 5.5°S, 106.5°W | 200 | 160 | 80% | 0.692 |
| 11.5°S, 11.5°E | 196 | 155 | 79% | 0.697 |
| 15.5°N, 26.5°W | 196 | 154 | 79% | 0.606 |
| 8.5°S, 10.5°E | 196 | 151 | 77% | 0.640 |
| 9.5°S, 11.5°E | 90 | 69 | 77% | 0.630 |
| 11.5°N, 27.5°W | 196 | 150 | 77% | 0.622 |
| 6.5°N, 42.5°W | 166 | 127 | 77% | 0.677 |
| 9.5°N, 43.5°W | 168 | 128 | 76% | 0.679 |
| 12.5°S, 11.5°E | 92 | 70 | 76% | 0.650 |
| 6.5°S, 61.5°E | 192 | 146 | 76% | 0.640 |
| 9.5°N, 120.5°W | 196 | 148 | 76% | 0.612 |
| 13.5°S, 11.5°E | 104 | 78 | 75% | 0.660 |
| 13.5°S, 123.5°E | 196 | 146 | 74% | 0.556 |
| 16.5°N, 18.5°W | 198 | 146 | 74% | 0.619 |
| 7.5°N, 42.5°W | 200 | 146 | 73% | 0.646 |
| 22.5°S, 13.5°E | 92 | 67 | 73% | 0.592 |
| 23.5°S, 13.5°E | 194 | 140 | 72% | 0.604 |
| 25.5°S, 13.5°E | 196 | 140 | 71% | 0.549 |
| 6.5°N, 17.5°W | 198 | 141 | 71% | 0.605 |
| 0.5°S, 41.5°W | 166 | 117 | 70% | 0.606 |
| 24.5°S, 13.5°E | 106 | 74 | 70% | 0.586 |
What a scan row looks like
Eight rows drawn at random from the CSVs, five flagged and three not. lat and lon are the scene centre used for the map. swath_lat and swath_lon are the centre of that footprint's half of the swath, 35 km to the side. The box is the top detection in pixels, and is empty when nothing scored above 0.01.
| group | score_s1 | score_s2 | score_s3 | score | iw | box_x0 | box_y0 | box_x1 | box_y1 | lat | lon | swath_lat | swath_lon |
|---|---|---|---|---|---|---|---|---|---|---|---|---|---|
| Pass_009/491_009_35660/R | 0.9517 | 0.9311 | 0.9785 | 0.9538 | 1 | 0.0 | 0.0 | 220.0 | 659.4 | -11.309 | -82.096 | -11.358 | -81.768 |
| Pass_010/483_010_38265/L | 0.8092 | 0.7969 | 0.9047 | 0.837 | 1 | 0.9 | 21.5 | 220.0 | 653.1 | 6.53 | 85.794 | 6.575 | 86.097 |
| Pass_016/518_016_46563/R | 0.9394 | 0.7532 | 0.9774 | 0.89 | 1 | 1.2 | 1.9 | 220.0 | 660.0 | -11.108 | 11.268 | -11.157 | 10.941 |
| Pass_018/562_018_34301/L | 0.9506 | 0.8962 | 0.9772 | 0.9413 | 1 | 0.5 | 4.0 | 220.0 | 660.0 | 14.911 | -18.356 | 14.958 | -18.045 |
| Pass_019/494_019_50985/R | 0.0 | 0.0267 | 0.0141 | 0.0136 | 0 | 5.4 | 84.4 | 220.0 | 357.7 | 21.3 | 154.365 | 21.246 | 154.708 |
| Pass_024/509_024_38262/L | 0.9297 | 0.91 | 0.9789 | 0.9395 | 1 | 0.4 | 1.8 | 220.0 | 660.0 | 6.516 | -94.201 | 6.561 | -93.897 |
| Pass_024/509_024_70602/L | 0.0199 | 0.0127 | 0.0712 | 0.0346 | 0 | 2.0 | 512.6 | 220.0 | 659.7 | -61.185 | -74.333 | -61.058 | -73.764 |
| Pass_026/560_026_39273/R | 0.0102 | 0.0332 | 0.0229 | 0.0221 | 0 | 2.4 | 19.2 | 217.8 | 656.2 | 4.319 | -119.589 | 4.271 | -119.911 |
The code
The figure code is in rfdetr PR #16. The other files are on the auto-experiments branch.
scan() in src/viz/paper_figures.py, draws Figure 3
def scan(out: Path) -> None:
    """World map of archive footprints flagged IW, and the archive score distribution."""
    rows = read_scan(Path("runs/scan_full"))
    lon = (np.array([float(r["lon"]) for r in rows]) + 180) % 360 - 180
    lat = np.array([float(r["lat"]) for r in rows])
    score = np.array([float(r["score"]) for r in rows])
    iw = np.array([int(r["iw"]) for r in rows])
    edges = np.arange(-180, 181, 1.0), np.arange(-90, 91, 1.0)
    count, _, _ = np.histogram2d(lon, lat, edges)
    hits, _, _ = np.histogram2d(lon, lat, edges, weights=iw)
    cx, cy = np.nonzero(count >= 10)
    frac = hits[cx, cy] / count[cx, cy]
    order = np.argsort(frac)

    fig = plt.figure(figsize=(TEXTWIDTH, 2.25))
    gs = fig.add_gridspec(1, 2, width_ratios=[2.9, 1], wspace=0.4, left=0.01, right=0.99,
                          bottom=0.17, top=0.88)
    ax = fig.add_subplot(gs[0], projection=ccrs.Robinson())
    ax.set_global()
    ax.add_feature(cfeature.LAND, facecolor="#e6e6e6", edgecolor="none", zorder=0)
    ax.add_feature(cfeature.COASTLINE, edgecolor=MUTED, linewidth=0.3, zorder=1)
    ax.spines["geo"].set_edgecolor(MUTED)
    ax.spines["geo"].set_linewidth(0.5)
    dots = ax.scatter(edges[0][cx][order] + 0.5, edges[1][cy][order] + 0.5, c=frac[order], s=2.5, lw=0,
                      cmap="YlOrRd", vmin=0, vmax=0.6, transform=ccrs.PlateCarree(), rasterized=True, zorder=2)
    cbar = fig.colorbar(dots, cax=ax.inset_axes([1.01, 0.1, 0.02, 0.8]), extend="max")
    cbar.set_label("fraction flagged", labelpad=2)
    cbar.outline.set_linewidth(0.4)
    ax.set_title("(a) archive footprints flagged as internal wave", loc="left", fontsize=8.5)

    hax = fig.add_subplot(gs[1])
    style_grid(hax)
    hax.hist(score, bins=np.linspace(0, 1, 41), color="#2a78d6", lw=0)
    hax.set_yscale("log")
    hax.axvline(THRESHOLD, color=INK, lw=0.8, ls=(0, (3, 1.5)))
    hax.text(THRESHOLD + 0.02, 0.95, f"threshold {THRESHOLD}", transform=hax.get_xaxis_transform(),
             fontsize=6.5, va="top")
    hax.set_xlabel("classifier score")
    hax.set_ylabel("footprints")
    hax.set_title("(b) archive score distribution", loc="left", fontsize=8.5)
    fig.savefig(out, dpi=600)
    plt.close(fig)
src/data/footprint_latlon.py, fits the orbit and places each footprint
"""Fit a SWOT repeat-orbit ground-track model to labeled footprints; predict lat/lon per (pass, line, side)."""
from __future__ import annotations

import argparse
import csv
import json
from pathlib import Path

import numpy as np
from scipy.optimize import least_squares

MASTER = Path("/mnt/lustre/koa/koastore/ore_waves_group/data/swot/labeled/iw_master.csv")
EARTH_KM = 6371.0
E2 = 0.00669438                       # WGS84 eccentricity squared
NAMES = ["lam0_rad", "phase_asc_rad", "phase_desc_rad", "rad_per_line", "crosstrack_km",
         "incl_rad", "earth_turns_per_rev"]
# node lon, phases, 250 m lines, swath centre offset, 77.6 deg, 21-day / 292-rev repeat
START = np.array([np.radians(22.0), 0.008, -0.002, 3.81e-5, -40.0, np.radians(77.6), 21 / 292])
SWATH_CENTRE_KM = 35.0               # KaRIn swaths span 10-60 km either side of nadir
TRUSTED_KM = 10.0                     # per-pass correction kept only if its held-out median is below this
SCALE = np.array([0.01, 0.001, 0.001, 1e-7, 1.0, 0.001, 1e-4])


def load_labeled(path: Path = MASTER):
    """(pass, line index, lat, lon) of every labeled footprint; all are side R."""
    rows = []
    with open(path, encoding="utf-8") as fh:
        for row in csv.DictReader(fh):
            _, pas, idx = map(int, row["base_image_id"].split("_"))
            rows.append((pas, idx, float(row["lat"]), float(row["lon"])))
    return np.array(rows, dtype=float)


def _nadir(params, pas, idx):
    """Unit ECEF vectors of the nadir point; u counts from the south turning point of pass 1."""
    lam0, c_asc, c_desc, k, _, inc, rep = params
    u = -np.pi / 2 + np.pi * (pas - 1) + np.where(pas % 2 == 1, c_asc, c_desc) + k * idx
    x, y, z = np.cos(u), np.cos(inc) * np.sin(u), np.sin(inc) * np.sin(u)
    lon = lam0 + np.arctan2(y, x) - rep * u
    lat = np.arcsin(z)
    return np.stack([np.cos(lat) * np.cos(lon), np.cos(lat) * np.sin(lon), np.sin(lat)], -1)


def predict(params, pas, idx, side):
    """Geodetic (lat, lon) in degrees; side is +1 for R, -1 for L (swath mirrored about nadir)."""
    pas, idx, side = (np.asarray(a, dtype=float) for a in (pas, idx, side))
    here = _nadir(params, pas, idx)
    ahead = _nadir(params, pas, idx + 10.0)
    right = np.cross(ahead - here, here)
    right /= np.linalg.norm(right, axis=-1, keepdims=True)
    delta = side[..., None] * params[4] / EARTH_KM
    point = np.cos(delta) * here + np.sin(delta) * right
    lat_c = np.arcsin(np.clip(point[..., 2], -1, 1))
    lat = np.degrees(np.arctan(np.tan(lat_c) / (1 - E2)))
    lon = (np.degrees(np.arctan2(point[..., 1], point[..., 0])) + 180) % 360 - 180
    return lat, lon


def _resid(params, data):
    lat, lon = predict(params, data[:, 0], data[:, 1], np.ones(len(data)))
    dlon = (lon - data[:, 3] + 180) % 360 - 180
    return np.concatenate([(lat - data[:, 2]) * 111.2,
                           dlon * 111.2 * np.cos(np.radians(data[:, 2]))])


def error_km(params, data):
    """Per-point model-minus-label distance (local flat-earth km)."""
    return np.hypot(*_resid(params, data).reshape(2, -1))


def fit(data):
    """Robust least-squares fit of all seven orbit parameters."""
    best = None
    for lam0 in np.radians(np.arange(12.0, 32.0, 2.0)):
        res = least_squares(_resid, np.r_[lam0, START[1:]], args=(data,), loss="soft_l1",
                            f_scale=5.0, x_scale=SCALE)
        if best is None or res.cost < best.cost:
            best = res
    return best.x


def pass_phase(params, data):
    """Along-track phase correction for one pass's labeled rows."""
    def resid(x):
        return _resid(np.r_[params[0], params[1:3] + x[0], params[3:]], data)
    return float(least_squares(resid, [0.0], loss="soft_l1", f_scale=5.0).x[0])


def pass_corrections(params, data, seed=0):
    """{pass: phase} for passes whose correction holds up on a 2-fold within-pass split."""
    rng = np.random.default_rng(seed)
    out = {}
    for pas in np.unique(data[:, 0]):
        rows = rng.permutation(np.flatnonzero(data[:, 0] == pas))
        halves = rows[:len(rows) // 2], rows[len(rows) // 2:]
        errs = []
        for train, test in (halves, halves[::-1]):
            dc = pass_phase(params, data[train])
            errs.append(error_km(np.r_[params[0], params[1:3] + dc, params[3:]], data[test]))
        held = float(np.median(np.concatenate(errs)))
        print(f"  pass {int(pas):3d} corrected, held-out median {held:.2f} km")
        if held < TRUSTED_KM:
            out[int(pas)] = pass_phase(params, data[data[:, 0] == pas])
    return out


def load_fit(path: Path):
    """(parameter vector, {pass: phase correction}) from the json written by main."""
    saved = json.loads(path.read_text(encoding="utf-8"))
    return np.array([saved[n] for n in NAMES]), {int(k): v for k, v in saved["pass_phase"].items()}


def footprint_latlon(model, pas, idx, side):
    """Scene-centre and swath-centre (lat, lon) for arrays of pass, line index and side ('L'/'R')."""
    params, phase = model
    pas, idx = np.asarray(pas, dtype=float), np.asarray(idx, dtype=float)
    dc = np.array([phase.get(int(p), 0.0) for p in pas])
    shifted = idx + dc / params[3]
    centre = predict(params, pas, shifted, np.ones(len(pas)))
    sign = np.where(np.asarray(side) == "R", 1.0, -1.0)
    swath = np.r_[params[:4], [SWATH_CENTRE_KM], params[5:]]
    return centre, predict(swath, pas, shifted, sign)


def main() -> None:
    """Fit on all labeled rows, report leave-one-pass-out error, write the parameters."""
    ap = argparse.ArgumentParser(description=__doc__)
    ap.add_argument("--out", type=Path, required=True, help="parameters json")
    opts = ap.parse_args()
    data = load_labeled()
    params = fit(data)
    err = error_km(params, data)
    print(f"in-sample km: median {np.median(err):.2f}  p95 {np.percentile(err, 95):.2f}  max {err.max():.0f}")
    held = []
    for pas in np.unique(data[:, 0]):
        mask = data[:, 0] == pas
        held.append(error_km(fit(data[~mask]), data[mask]))
        print(f"  pass {int(pas):3d} held out: n {mask.sum():3d}  median {np.median(held[-1]):.2f} km")
    held = np.concatenate(held)
    print(f"leave-pass-out km: median {np.median(held):.2f}  p95 {np.percentile(held, 95):.2f}  "
          f"max {held.max():.0f}")
    phase = pass_corrections(params, data)
    print(f"per-pass corrections kept for {sorted(phase)}")
    saved = dict(zip(NAMES, map(float, params))) | {"pass_phase": phase}
    opts.out.write_text(json.dumps(saved, indent=1), encoding="utf-8")
    print(dict(zip(NAMES, np.round(params, 8))))


if __name__ == "__main__":
    main()
src/eval/scan_h5.py, scores every footprint and writes the CSVs
"""Run the frozen IW classifier over every footprint of one pass in full_data_v1.h5 and write a CSV with lat/lon."""
from __future__ import annotations

import argparse
import csv
import logging
import time
from pathlib import Path

import h5py
import numpy as np
from PIL import Image

from src.data.build_channel_variant import transform
from src.data.footprint_latlon import MASTER, footprint_latlon, load_fit
from src.viz.visualize_boxes import load_model
from src.viz.visualize_compare import predict_boxes_letterboxed_with_class

LOGGER = logging.getLogger(__name__)
H5 = Path("/mnt/lustre/koa/koastore/ore_waves_group/data/swot/full_data_v1.h5")
FINAL = Path("runs/rfdetr/final/cls_iwfp_dropssh_fusion3")
CKPTS = ("s1_checkpoint_89.ckpt", "s2_checkpoint_39.ckpt", "s3_checkpoint_79.ckpt")
THRESHOLD = 0.325
MIN_SCORE = 0.01
FIELDS = ["group", "cycle", "pass", "line", "side", "valid_frac", "score_s1", "score_s2", "score_s3",
          "score", "iw", "box_x0", "box_y0", "box_x1", "box_y1", "lat", "lon", "swath_lat", "swath_lon",
          "labeled"]


def footprint_image(stacked) -> tuple[Image.Image, float]:
    """The classifier's dropssh RGB input from a (3, 660, 220) stack, and the non-NaN fraction of raw."""
    valid = float(np.isfinite(stacked[0]).mean())
    arr = np.clip(np.transpose(stacked, (1, 2, 0)), 0, 255).astype("uint8")
    return Image.fromarray(transform(arr, "dropssh")), valid


def top_box(models, image):
    """Per-model max IW score and the box of the single highest-scoring detection."""
    scores, best = [], (0.0, None)
    for model in models:
        preds = predict_boxes_letterboxed_with_class(model, image, MIN_SCORE)
        top = max(preds, key=lambda p: p[1], default=None)
        scores.append(float(top[1]) if top else 0.0)
        if top and top[1] > best[0]:
            best = (float(top[1]), top[0])
    return scores, best[1]


def labeled_groups(path: Path = MASTER) -> set[str]:
    """h5 groups (Pass_xxx/scene/side) that carry human labels."""
    with open(path, encoding="utf-8") as fh:
        return {row["h5_group"] for row in csv.DictReader(fh)}


def footprint_row(h5, group: str, models, fit, labeled: set[str]) -> dict:
    """Classify one footprint and locate it."""
    # pylint: disable=too-many-locals
    _, scene, side = group.split("/")
    cycle, pas, line = map(int, scene.split("_"))
    image, valid = footprint_image(h5[group]["stacked"][...])
    scores, box = top_box(models, image) if valid > 0 else ([0.0] * 3, None)
    (lat, lon), (slat, slon) = (np.ravel(v) for v in footprint_latlon(fit, [pas], [line], [side]))
    score = float(np.mean(scores))
    corners = [round(float(v), 1) for v in box] if box is not None else [""] * 4
    return {"group": group, "cycle": cycle, "pass": pas, "line": line, "side": side,
            "valid_frac": round(valid, 4),
            **{f"score_s{i}": round(s, 4) for i, s in enumerate(scores, 1)},
            "score": round(score, 4), "iw": int(score >= THRESHOLD),
            **dict(zip(("box_x0", "box_y0", "box_x1", "box_y1"), corners)),
            "lat": round(float(lat), 3), "lon": round(float(lon), 3),
            "swath_lat": round(float(slat), 3), "swath_lon": round(float(slon), 3),
            "labeled": int(group in labeled)}


def scan(pass_name: str, out: Path, limit: int | None, resolution: int) -> None:
    """Append one row per footprint of the pass to out, skipping footprints already written."""
    # pylint: disable=too-many-locals
    done = set()
    if out.exists():
        with open(out, encoding="utf-8") as fh:
            done = {row["group"] for row in csv.DictReader(fh)}
    models = [load_model(FINAL / name, resolution=resolution) for name in CKPTS]
    fit, labeled = load_fit(out.parent / "latlon_params.json"), labeled_groups()
    with h5py.File(H5, "r") as h5, open(out, "a", newline="", encoding="utf-8") as fh:
        writer = csv.DictWriter(fh, FIELDS, extrasaction="ignore")
        if not done:
            writer.writeheader()
        scenes = sorted(h5[pass_name])[:limit]
        tic = time.time()
        for n, scene in enumerate(scenes, 1):
            for side in ("L", "R"):
                group = f"{pass_name}/{scene}/{side}"
                if group not in done:
                    writer.writerow(footprint_row(h5, group, models, fit, labeled))
            if n % 200 == 0 or n == len(scenes):
                fh.flush()
                LOGGER.info("%s [%d/%d] scenes, %.2f s/scene", pass_name, n, len(scenes),
                            (time.time() - tic) / n)


def main() -> None:
    """Scan one pass; the pass comes from --pass or the Slurm array index."""
    logging.basicConfig(level=logging.INFO, format="%(asctime)s %(levelname)s: %(message)s")
    ap = argparse.ArgumentParser(description=__doc__)
    ap.add_argument("--pass-name", required=True, help="h5 group, e.g. Pass_001")
    ap.add_argument("--out-dir", type=Path, default=Path("runs/scan_full"))
    ap.add_argument("--limit", type=int, default=None, help="first N scenes, for smoke tests")
    ap.add_argument("--resolution", type=int, default=560)
    opts = ap.parse_args()
    suffix = f"_limit{opts.limit}" if opts.limit else ""
    scan(opts.pass_name, opts.out_dir / f"{opts.pass_name}{suffix}.csv", opts.limit, opts.resolution)


if __name__ == "__main__":
    main()
read_scan() in src/viz/plot_scan_map.py, loads the CSVs
def read_scan(scan_dir: Path) -> list[dict]:
    """All scan rows from the per-pass CSVs."""
    rows = []
    for path in sorted(glob.glob(str(scan_dir / "Pass_*.csv"))):
        with open(path, encoding="utf-8") as fh:
            rows.extend(csv.DictReader(fh))
    return rows
Read the map with care
- The colour is what the classifier says, not confirmed waves. A visual check of 24 random flagged footprints found real wave trains but also wind streaks, cloud-like texture and sea ice.
- The 0.325 cutoff comes from 110 validation footprints. Precision on the archive has not been measured yet.
- The 1,100 labeled footprints are in the map too, 0.3% of the rows.
- The tracks only cover the 1-day Cal/Val orbit, so the map shows these 28 lines and not the whole ocean.
- A DINOv2 classifier, which ties RF-DETR on validation, is now scanning the same archive (job 15050957) so the two maps can be compared.
Sources: runs/scan_full/Pass_*.csv and latlon_params.json in rfdetr, iw_master.csv on koastore, runs/rfdetr/final/cls_iwfp_dropssh_fusion3/README.txt, and a rerun of src.data.footprint_latlon that reproduced the saved parameters.